turning data
into stories.
Unlock your data’s story.
DTO Analytics transforms it into clear, actionable insights.

from data
to discovery.
We go beyond traditional charts and reports, transforming raw data into interactive experiences that inform, inspire, and engage. Whether for businesses, educators, or media, we bring your data to life with storytelling and dynamic visuals.

Data Meets Storytelling.
We don’t just visualize data—we craft compelling narratives that bring your insights to life. Whether it’s a business report, an educational tool, or a media feature, we turn numbers into stories that connect with your audience.


Interactive & Engaging Visuals.
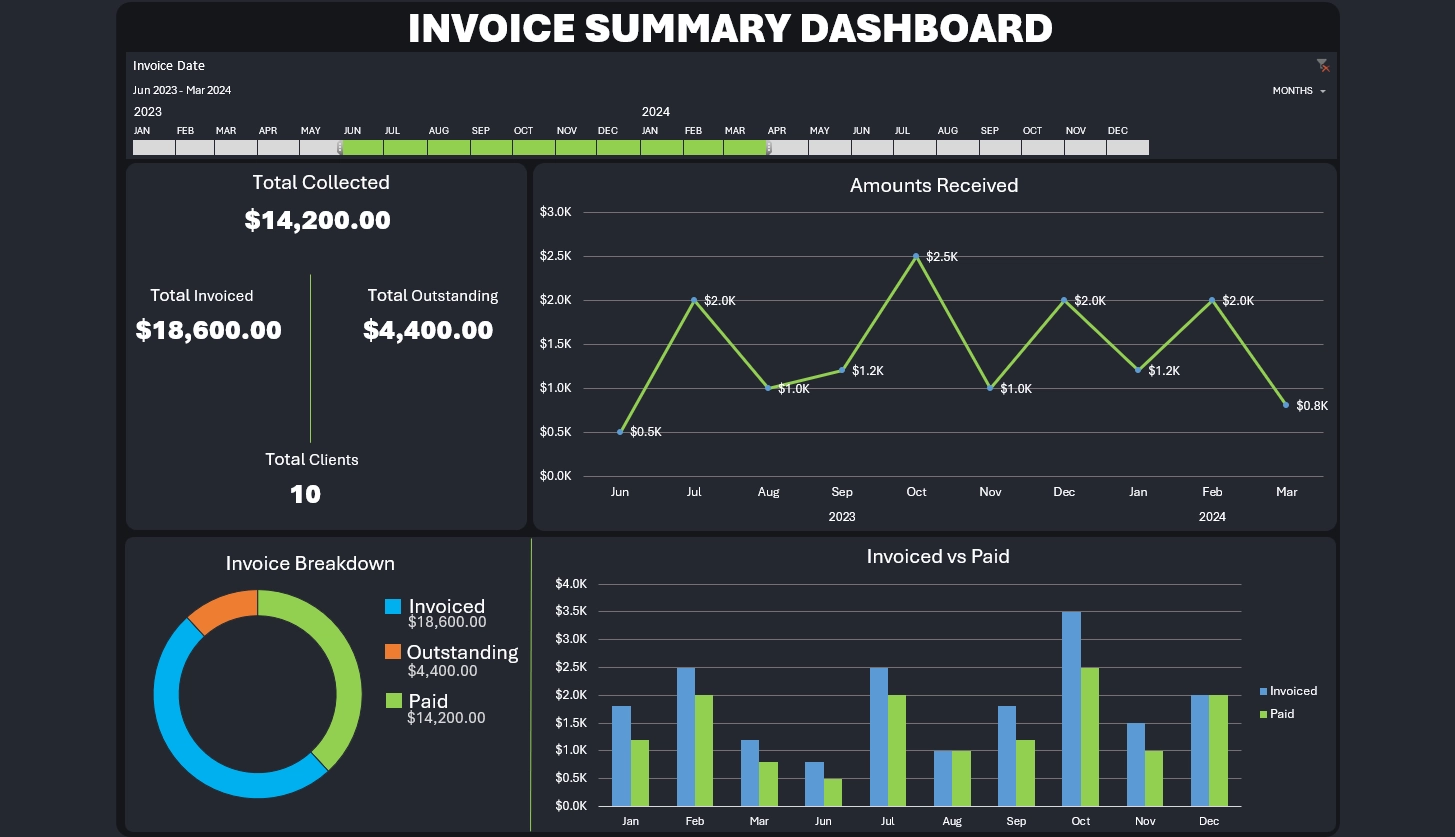
Static charts don’t capture attention. Our interactive dashboards, animations, and custom data experiences let users explore and engage with the information, making complex data intuitive and accessible.

Tailored Solutions for Your Needs.
Every story is unique, and so is your data. We design visual experiences that align with your brand, goals, and audience—whether you need investor reports, marketing insights, or immersive storytelling.
see your data in action.
Whether you’re working with PowerBI, Excel, Tableau, or Flourish, we transform your data into stunning dashboards and visuals—because great insights deserve more than just a spreadsheet!

Smart Data, Smarter Decisions.
Contact us today to get more out of your data.


